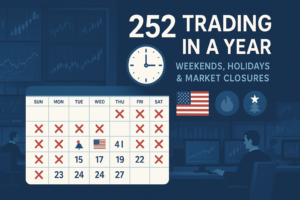
The number of trading days in the US stock market varies slightly from year to year due to weekends, holidays, and occasional unscheduled closures (such as emergencies or technical issues). On average, the New York Stock Exchange (NYSE) and Nasdaq are open for trading about 252 days per year.
In this article, we’ll break down:
- The standard trading schedule
- Market holidays when exchanges are closed
- How trading days are calculated
- Variations from year to year
Table of Contents
1. Standard Trading Schedule in the US Stock Market
The US stock market operates Monday through Friday, excluding weekends and designated holidays.
- Regular trading hours: 9:30 AM – 4:00 PM ET
- Premarket & after-hours trading: Available but with lower liquidity
Since weekends (Saturdays and Sundays) are always non-trading days, there are 104 weekend days per year, leaving 261 potential weekdays for trading. However, holidays further reduce this number.
2. US Stock Market Holidays (When Exchanges Are Closed)
The NYSE and Nasdaq observe the following holidays, resulting in market closures:
| Holiday | Typical Date |
|---|---|
| New Year’s Day | January 1 (or the nearest weekday) |
| Martin Luther King Jr. Day | Third Monday in January |
| Presidents’ Day (Washington’s Birthday) | Third Monday in February |
| Good Friday | Friday before Easter Sunday (varies) |
| Memorial Day | Last Monday in May |
| Juneteenth National Independence Day | June 19 (since 2022) |
| Independence Day | July 4 (or nearest weekday) |
| Labor Day | First Monday in September |
| Thanksgiving Day | Fourth Thursday in November |
| Christmas Day | December 25 (or nearest weekday) |
Notes on Holiday Closures:
- Good Friday: The stock market is closed even though it’s not a federal holiday.
- Early Closures: On Black Friday (day after Thanksgiving) and Christmas Eve (if it falls on a weekday), the market closes early (1:00 PM ET).
- Floating Holidays: If a holiday falls on a weekend, the market typically closes on the nearest weekday (e.g., July 4th on a Saturday → closed Friday, July 3).
3. Calculating the Exact Number of Trading Days in a Year
To determine the exact number of trading days in a given year:
- Start with total weekdays: 365 days – 104 weekend days = 261 weekdays.
- Subtract market holidays: Typically 9–10 days (varies slightly).
- Adjust for floating holidays & early closures.
Example Calculation for 2024:
- Total weekdays: 262 (2024 is a leap year)
- Market holidays: 10 (including Juneteenth and Good Friday on March 29)
- Estimated trading days: 252
Historical Averages:
- Average over 10 years: ~252 trading days per year
- Minimum: ~248 (if holidays fall on weekdays more frequently)
- Maximum: ~253 (if holidays align with weekends)
4. Why Does the Number of Trading Days Matter?
- Investors & traders: Helps in planning strategies, tax-loss harvesting, and portfolio rebalancing.
- Algorithmic trading: Quant models rely on precise trading day counts for backtesting.
- Annualized returns: Many performance metrics are calculated on a 252-day basis.
5. Exceptions & Rare Market Closures
While rare, the stock market has closed unexpectedly due to:
- September 11, 2001 (4-day closure)
- COVID-19 pandemic (no full closures, but extreme volatility)
- Technical glitches (e.g., 2015 Nasdaq halt for ~3 hours)
These events are not factored into the standard trading day count.
Final Answer: How Many Trading Days in a Year?
✔ Average: 252 trading days per year
✔ Range: Usually between 250–253, depending on holidays
For precise numbers, check the NYSE or Nasdaq official holiday schedules for a given year.


Recent Comments